After the Bot Scare: Understanding What’s Been Happening With Data Collection on MTurk and How to Stop It

By Aaron Moss, PhD & Leib Litman, PhD
Highlights
- Since early August, researchers have worried that “bots” are contaminating data collected on MTurk.
- We found workers who submit HITs from suspicious geolocations are using server farms to hide their true location.
- When using CloudResearch tools to block workers from server farms, we collected high quality data from MTurk workers.
- We also collected data from workers who use server farms to learn more about them.
- Our evidence suggests recent data quality problems are tied to foreign workers, not bots.
In this blog, we review recent concerns about bots, along with general data quality issues, on Mechanical Turk and report the results of a study we conducted to investigate the problem.
People who have closely followed the academic conversation about this issue may jump straight to our study and results (though we think the background provides useful context for all readers). For those less informed about the problem, we begin with an overview of recent data quality issues on MTurk.
Background
Over the past few months, researchers have noticed a spike in poor quality survey responses collected on MTurk, often with responses originating from repeated geolocations. This spike has spurred concern about the integrity of studies conducted on MTurk and rumors about bots have compounded fear and suspicion. Because data quality is a top priority at CloudResearch, we’ve applied all our research, engineering, and investigative resources to the issue. A dive into our data warehouse of more than fifteen million completed assignments has yielded compelling insights. In this report, we share what we’ve learned.
Repeated Geolocations and Server Farms
We begin with repeated geolocations—a key indication that something was amiss with data collected on MTurk this summer. Alongside each survey response, Qualtrics (and some other platforms) provides a latitude-longitude pair as an estimate of the worker’s geographic location. That estimate is obtained via third-party services that map Internet Provider (IP) addresses to physical coordinates. It’s crucial to note that Internet Provider (IP) to geolocation mapping services aren’t very precise and sometimes map tens of IP addresses within a larger radius to an identical coordinate pair. Thus, two workers taking a survey in the same city could easily appear to originate from the same geolocation (for more information on this see here). Duplicate coordinates don’t necessarily indicate that bad actors are involved.
With that said, however, researchers reported over the summer that many blatantly poor responses were tied to repeated geolocations. Clearly then, some duplicate geolocations indicate illicit worker activity. Over the past few weeks, we’ve identified those suspicious locations and explored their nature.
We found around sixty locations from which some workers have been submitting HITs are tied to ‘server farms’ (see Dennis, Goodson, & Pearson, 2018). A server farm or data center is a physical location that houses clusters of servers. When someone uses a server farm to interact with the web, all of their internet transactions are “routed” through the servers. Thus, a server farm effectively masks a user’s digital footprint. A user can sit at their computer and connect remotely to a server farm, miles away or thousands of miles away. In this way, a server farm enables users to access content or portals that are restricted based on their actual, physical location.
After learning that some MTurk workers have used server farms to submit HITs and identifying the server farms they’ve used, we wanted to ask a number of other questions. First, what can we learn about workers who use server farms by inviting them to take our HIT? Second, how effective are CloudResearch’s tools at blocking these workers from taking HITs and contaminating studies? A few weeks ago we introduced two features that allow researchers to block submissions from server farms when using CloudResearch. To find out how effective these tools are, we conducted an experimental investigation that is reported below.
Our Investigation: What We Did
To learn about workers using server farms and how effective CloudResearch’s solution is at blocking them, we conducted a study which included a series of data quality checks. Our study examined response characteristics and data quality among workers known to operate through server farms (i.e., farmers) and workers known to operate without server farms (i.e., non-farmers). We refer to workers completing HITs from server farms as ‘farmers’ instead of ‘bots,’ because the term ‘farmer’ is agnostic as to whether these workers are humans, bots, or humans using some form of automation.
How We Sampled
Farmers
For farmers, we began by identifying workers known to submit most of their HITs from server farms. To identify these workers we used the CloudResearch database, which contains information from every study (> 100,000) and every assignment (> 15 million) ever submitted on our platform. Our query targeted workers who submitted more than 80% of their HITs from known server farms. This search resulted in a list of 560 workers. We set up our experiment on CloudResearch and invited these workers to the study with an email invitation. The study was limited to US participants, paid $2.00, was advertised to take 20 minutes, and within 24 hours we had over 140 responses so we closed the study.
Non-farmers
For non-farmers, we setup our study on CloudResearch and specified that workers have greater than a 95% approval rating and more than 100 HITs completed—extremely common qualifications. In addition to these qualifications, we used our “Block Suspicious Locations” and “Block Duplicate Geolocations” tools, and we excluded the list of farmers created for sample 1. Other than these parameters, the non-farmer sample was open to every worker on MTurk within the US. The study was advertised the same way as the survey targeting farmers; within three hours we had 100 responses and closed the study.
Measures
We had four measures of data quality: 1) reliability of self-report on the Big Five Inventory, 2) effect size on the trolley dilemma, 3) effect size on the Mt. Everest anchoring task, and 4) engagement with open-ended questions.
We also used four measures to learn more about farmers. Specifically, we included measures meant to decipher whether farmers were bots or humans, and, if humans, where they are from. The measures included: 1) a re-capthca, 2) a honey pot, 3) an English proficiency screener, and 4) a series of cultural questions meant to reveal whether farmers were American or foreign. Workers on MTurk predominantly originate from two countries: the US and India. We therefore guessed that if workers were not American, they were likely to be Indian. Our screener and cultural questions were mean to reveal such information.
Big-five inventory
The BFI questionnaire (John, Robins, & Pervin, 2008) consists of 44 short, declarative statements such as “Is talkative.” Participants indicated whether each statement applied to them using a five point scale (1 – strongly agree to 5 – strongly disagree). We added ten items that were direct antonyms of original items. For example “tends to be organized” was reversed to be “tends to be disorganized.” These synonym-antonym pairs allowed us to examine the consistency of individual participants’ responses with the Squared Discrepancy Procedure, described in detail in our paper on how to measure data quality on MTurk (Litman, Robinson, & Rosenzweig, 2015).
Why we included this measure. The BFI was included in our study because it provided a standard questionnaire with which to examine the reliability and consistency of participant responses. Unsurprisingly, we expected farmers’ reliability scores would be very low. In addition, we used the Squared Discrepancy Procedure (Litman, Robinson, & Rosenzweig, 2015) to see how many people responded randomly.
Trolley dilemma
The trolley dilemma is a classic thought experiment (Thomason, 1976; Foot 1967) that asks participants whether they would sacrifice one person’s life in order to save five others. Participants were randomly assigned to one of two versions of the dilemma. In the classic version, participants were asked whether they would kill one person to save five when doing so requires flipping a switch to turn the trolley onto another track. In the footbridge version, participants were asked whether they would kill one person to save five when doing so requires pushing an innocent bystander in front of the train. Several studies have repeatedly found that people are more willing to sacrifice one life to save five when doing so requires turning the train than pushing the man off the bridge (e.g. Hauser et al, 2007). Participants responded to the dilemma on a 4-point scale (1-Definitely not, 2 – Probably not, 3 – Probably yes, 4-Definitely yes).
Why we included this measure. We included the trolley dilemma in our study because it requires participants to read and attend to a rather complex thought experiment. In addition, because the dilemma has been replicated so many times, there are clear standards to compare our data with.
Anchoring task: height of Mount Everest
Participants were asked to estimate the height of Mt. Everest after being randomly assigned to a low or high anchor condition. In the low anchor condition, participants were asked whether Mt. Everest is greater or less than 2,000 feet. In the high anchor condition, participants were asked whether Mt. Everest is greater or less than 45,000 feet. Jacowitz and Kahneman (1995) found that people exposed to the high anchor tend to provide larger estimates than people exposed to the low anchor.
Why we included this measure. The anchoring task was used in our experiment because unlike the trolley dilemma it contains short sentences with basic English words that are easy to comprehend without much attention. For priming effects to work, however, participants must still pay attention. Thus, the success or failure of the manipulation provided insight into whether participants were paying attention to basic questions.
Open-ended questions
Over the summer, poor responses to open-ended questions served as a prime indicator of problematic participants. Thus, we asked workers to explain their decision in the trolley dilemma, to guess the hypothesis of the study, and to write at least two sentences describing their experience taking the study.
Re-captcha
A “CAPTCHA” is a simple Turing test—a method for distinguishing bots from humans. Re-captcha questions are provided by Google and while they are easy for humans they are difficult for bots or scripts to pass.
Honeypot
Honeypots act as a lure, enticing hackers or bad actors into a system so a user can learn more about them. Our honeypot was simple: we programmed a standard Qualtrics question and then layered a second “form” on top of the question. To a human taking the survey, only one screen and one answer box appeared. For a bot, however, two forms appeared—both requiring an answer. Any automated script would provide responses to both forms, clearly revealing whether automation was at work.
English proficiency screener
The screener contained four questions that presented a target word and asked participants to name a synonym. The target words were taken from the BFI. For example, one question asked “Which of the following words is most related to “moody”? Participants unfamiliar with basic English or who provide responses without reading are likely to fail the screener.
Cultural checks
We included 4 questions meant to reveal whether workers were Americans or foreigners. Two questions displayed a picture and asked workers to name the object pictured. The objects we chose have different referent words in American and Indian English. Two other questions asked participants to write the date circled on a calendar and to name the punctuation mark at the end of a sentence. Both the date and punctuation questions have different answers in the US and abroad.
Results
BFI
We examined reliability at the group and individual level. At the group level, cronbach’s alpha scores showed that 1) non-farmers had very high reliability scores and 2) farmers had very low reliability scores across all five BFI subscales (see Table 1).
Table 1: Alpha coefficients for the BFI
| Coefficients | Farmers | Non-farmers |
|---|---|---|
| O | .54 | .87 |
| C | .66 | .88 |
| E | .59 | .91 |
| A | .67 | .88 |
| N | .71 | .91 |
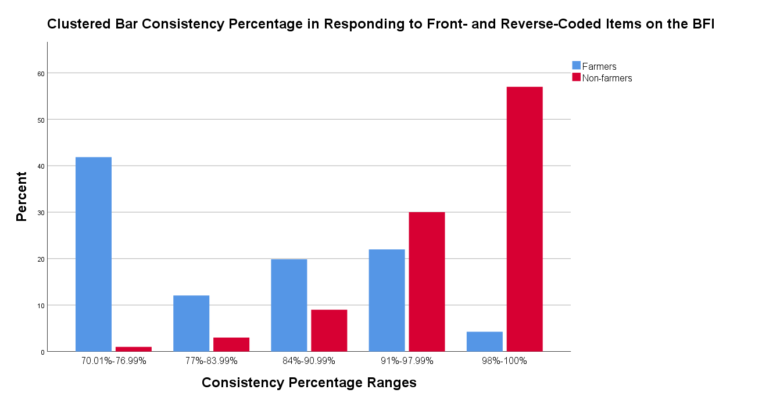
At the individual level, we used the Squared Discrepancy Procedure (SDP) to quantify the consistency of participant responses. The SDP examines how consistently participants respond to forward and reversed questions (e.g. “I tend to be organized” vs. “I tend to be disorganized”). Although the procedure is rather complex, the important point for our purposes is that the measure yields a number, expressed as a percentage, to describe how consistently participants respond to reversed items. Monte-Carlo simulations indicate that approximately 95% of randomly generated responses fall below an SDP score of 84 (Litman, Robinson, & Rosenzweig, 2015). As shown in Figure 1, only a few workers in the non-farmer group were in this range, compared to over 50% among farmers.
Trolley dilemma
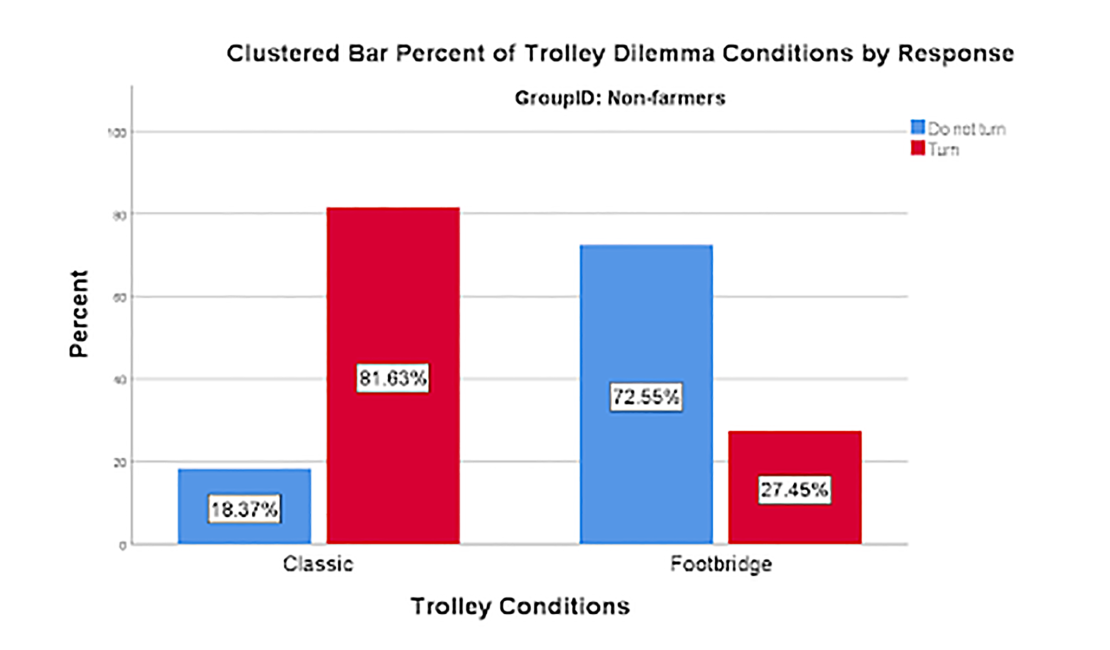
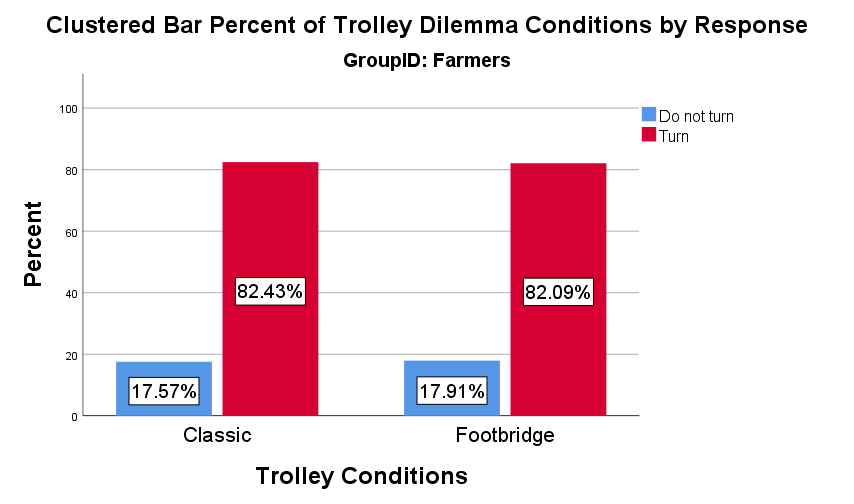
Non-farmers’ responses to the trolley dilemma replicated established findings. Non-farmers chose to turn the trolley when doing so required flipping a switch, but chose not to stop the trolley when doing so required pushing a man from the footbridge (see Figures 2 and 3). Farmers, on the other hand, chose to turn the trolley regardless of scenario. The decision-making of farmers was clearly not random (over 80% turned the Trolley in the classic version, as expected) nor in line with standard responding in the footbridge version.
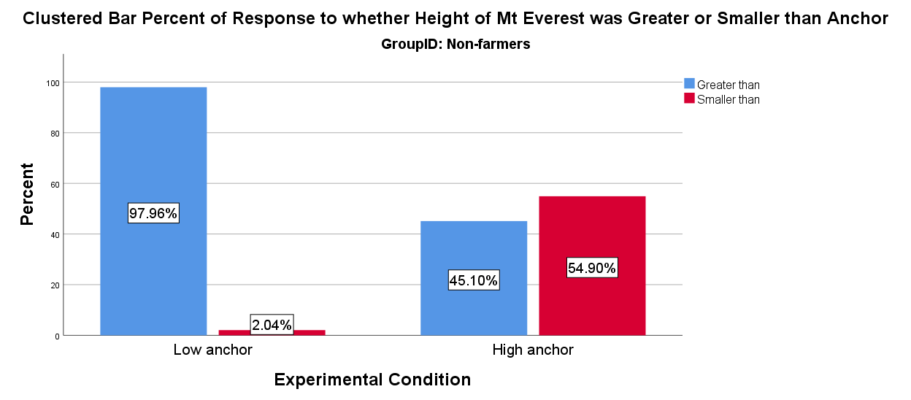
Anchoring task
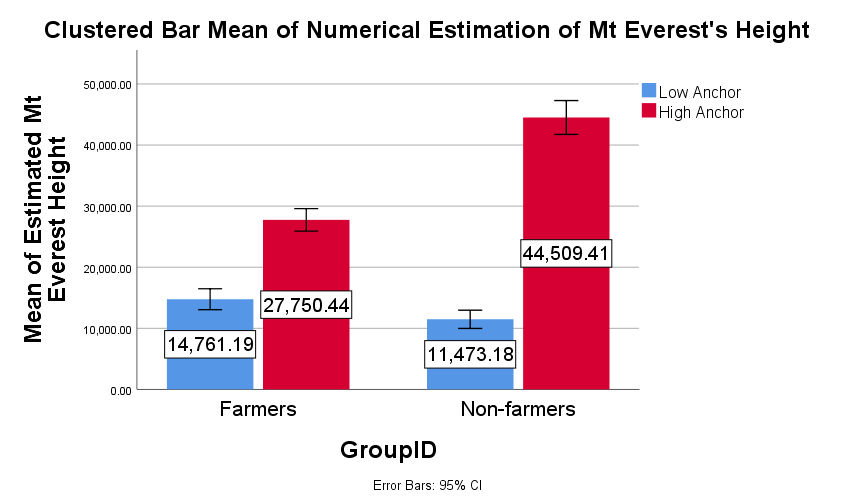
The anchoring task consisted of two questions. First, participants were asked whether Mt. Everest is higher than 2,000 ft. (low anchor) or lower than 45,000 feet (high anchor). As shown in Figures 4 and 5, farmers and non-farmers responded appropriately to the anchoring questions, regardless of condition. The second question asked participants to provide an open-ended guess at the height of Mt. Everest. As shown in Figure 6, the anchoring manipulation replicated in both the farmer and non-farmer samples. However, the size of the effect was much larger in the non-farmer group.
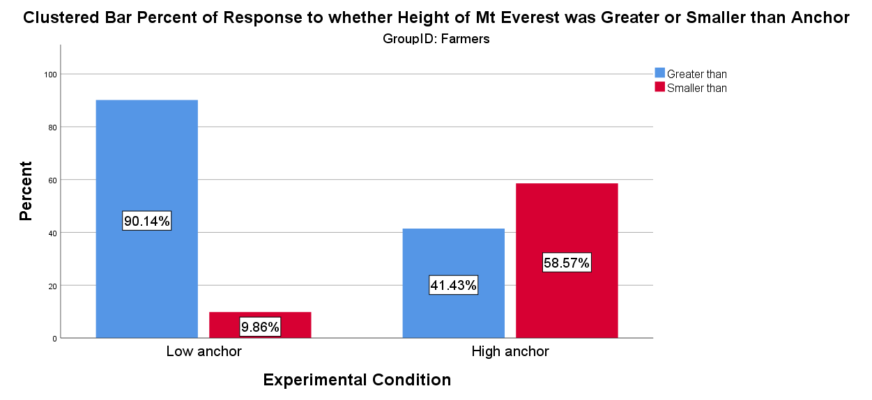
Participant responses to the anchoring task suggest a number of things beyond the quality of their data. First, the success of the manipulation suggests participants are humans. As far as we know, bots cannot be primed with anchoring manipulations. Second, the correct responses to the anchoring questions suggests farmers are paying some attention to questions and responding appropriately when questions are short, contain very basic English, and have straight forward answers. Finally, although we observed a smaller effect among farmers than non-farmers, farmers were more accurate in their estimates and by a large margin. The actual height of Mt. Everest is 29,029 ft. The relative accuracy of farmers compared to non-farmers implies farmers may be more familiar with Mt. Everest than non-farmers, a point we return to in the summary.
Open-ended responses
To save space, we report only responses to the question asking participants what they thought the hypothesis of the study was and why they thought that way. However, we observed a similar pattern across all open-ended questions.
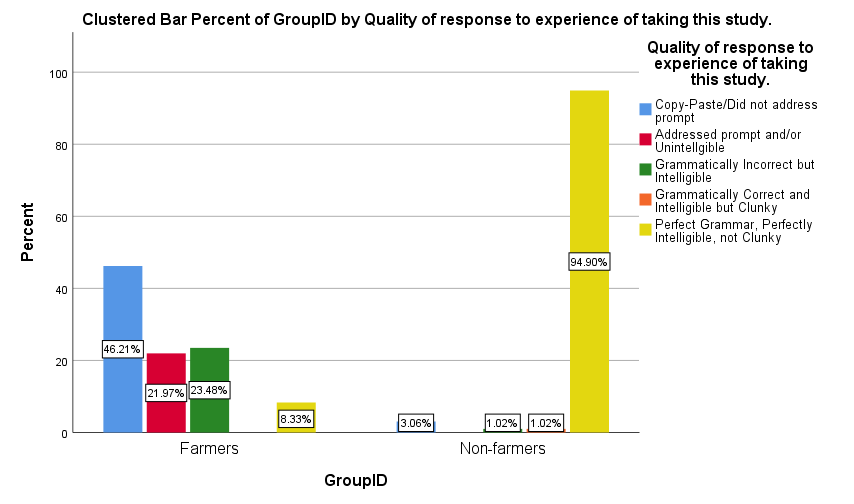
For open-ended questions, we had one coder read each response and decide whether the response was 1) irrelevant to the prompt or copy and pasted, 2) responding to the prompt but unintelligible, 3) grammatically incorrect but intelligible, 4) grammatically correct and intelligible but clunky, or 5) perfect grammatically, perfectly intelligible and not clunky. Our coder speaks Hindi and English fluently and as a result the coder was able to identify several responses that while grammatically incorrect in English were grammatically correct in languages spoken in India. This means our grammatically incorrect but intelligible category is probably larger than if the coder spoke only English.
The results of our coding are depicted in Figure 7. While nearly all responses from non-farmers were grammatically correct and made sense, responses from farmers were mixed. Some statements failed to address the prompt (e.g., “NICE,” “good study,” and clearly copy and pasted statements), while others addressed the prompt but made little sense (e.g, “This is psychological survey,” “very interesting and very hypothesis of this study”). Still other responses were grammatically incorrect but intelligible (e.g., “the hypothesis of this study is decision in a critical situation. because there is a situation to whether you safe of five persons or one persons. how make you to take decision at a particular situation”) or grammatically correct but clunky (e.g., You are examining the mood of the complex moments). Regardless of the category, it is clear non-farmers provided reasonable responses to the questions while farmers provided a mix of content, with over 90% of it being grammatically incorrect and low quality.
Re-captcha
100% of participants—both farmers and non-farmers—passed the re-captcha question.
Honeypot
100% of participants passed the honeypot, providing compelling evidence that participants are human.
English proficiency screener
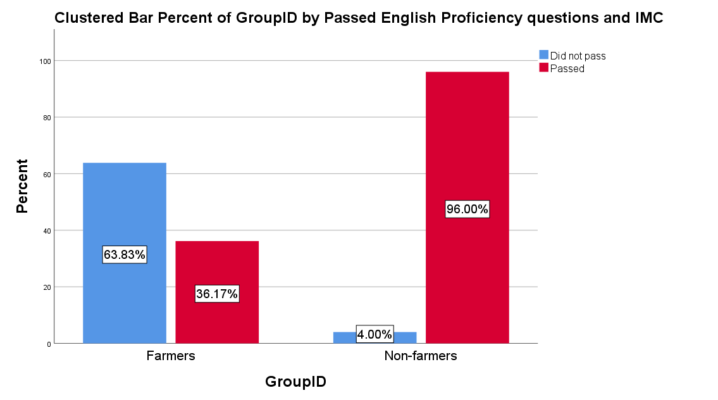
While nearly all non-farmers passed the English proficiency screener—answered all 4 questions correctly—a majority of farmers failed (see Figure 8).
Cultural checks
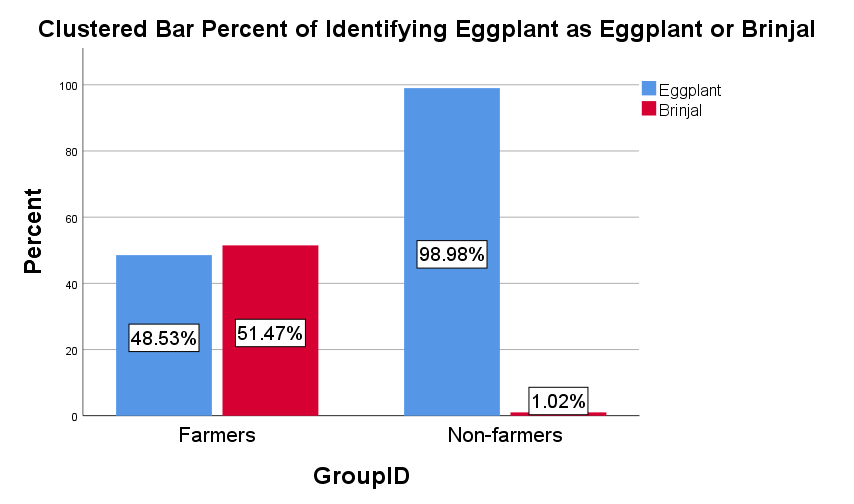
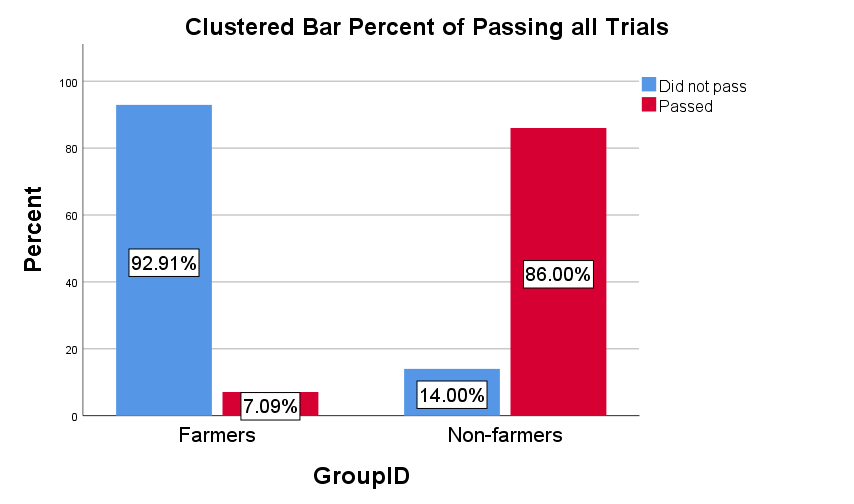
For the sake of space, we report the results of just one cultural check. We asked participants to name the vegetable shown in the picture below. In the US, people refer to this vegetable as an “eggplant,” but in India people refer to it as a “brinjal.” As shown in Figure 9, farmers were much more likely than non-farmers to refer to the vegetable in the picture as a brinjal, not an eggplant. Figure 10 shows pass rates across all four cultural checks.

Overall time on task
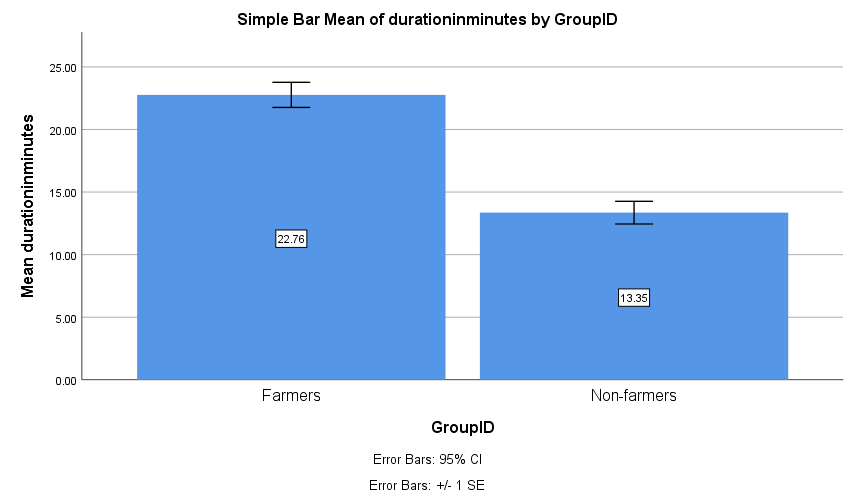
Finally, we looked at the total time it took participants to complete the study. As shown in Figure 11, farmers took nearly twice as long as non-farmers. Although this finding should be interpreted with caution, spending twice as long as the average worker is not consistent with the idea that bots have been programmed to quickly earn money on MTurk. Instead, it is consistent with the idea that farmers are workers who a) have a hard time reading and understanding English and so they spend longer on questions (this is consistent with what we see at the level of individual questions) and b) are taking multiple HITs at once.
Summary
Our investigation provided important insight into who farmers (i.e., workers who submit most of their HITs from server farms) are and where they are from. As expected, farmers’ data was very low quality—although, surprisingly, in some situations their data quality was similar to non-farmers. Most farmers responded randomly to the BFI. Farmers also showed unusual responses to the trolley dilemma. Importantly, farmers gave sub-standard answers to open-ended questions, in many cases providing the same answers that were linked to low quality data over the summer (e.g., nice study). In one summary statement, farmers looked a lot like the problems we saw on MTurk earlier this summer.
In addition to measures of data quality, we included several “bot-detection” measures in our study. Across these measures we found no evidence of bots—not one worker failed the re-captcha or honeypot. We did, however, find substantial evidence that farmers may be foreign workers operating outside the US. Farmers failed a basic English proficiency screener that 96% of non-farmers passed. In addition, while 95% of non-farmers referred to a pictured vegetable as an eggplant, 89% of farmers called the vegetable a ‘brinjal.’
Consistent with the idea that farmers are foreign workers with low English proficiency, we found they do well on tasks that involve short instructions written in basic English. For example, farmers responded correctly to anchoring questions about the height of Mt. Everest and although they had a smaller effect size on the Mt. Everest anchoring task the manipulation was still effective for them. This evidence in combination with farmers’ apparent knowledge about the height of Mt. Everest—a mountain in Nepal, just to the north of India—strongly implies that these workers are humans based in India.
Moving Forward
Our goal throughout the summer and this investigation has been to identify the source of low quality data on MTurk and then to erect strong and intelligent safeguards for the research community. While some research platforms have claimed their worker pools are above data quality problems, their claims are short-sighted and demonstrate a fundamental misperception about the challenge of preserving data quality online. People seeking fraudulent access to restricted portals are a problem as ancient as Troy, and no platform, whether physical or virtual, is impenetrable. The issue of poor quality responses is not contained to a single platform; rather, the illicit manipulation of online personas is a challenge across the internet as a whole. Only a system with continuous intelligent monitoring can effectively defend its community.
At CloudResearch, we already have several features in place (see here) to enable researchers to conduct high quality studies on MTurk by blocking submissions from server farms. In addition, the results of our experiment show that blocking workers who use server farms eliminates the “bot” problem. Finally, it is important to understand that there is no substitute for good data quality measures. Some people will always look for a way to game the system or may simply give low effort. Data quality measures ensure that researchers can find these people and remove their data.
In the coming weeks, we will continue to roll out new tools to help block suspicious workers and to maintain the quality of your studies. We recently developed a new feature to make it easier to block low quality workers. This feature is called “Universal Exclude,” and it lets researchers add workers to a persistent exclude list with a click of a button. We will post more details about this feature shortly. And, we will inform researchers of further findings regarding the nature of workers who use server farms.
References
Foot, P. (1978). The problem of abortion and the doctrine of the double effect. In Virtues and Vices and Other Essays in Moral Philosophy, 19-32. Berkeley and Los Angeles: University of California Press.
John, O. P., Robins, R.W., & Pervin, L. A. (2008). Paradigm shift to the integrative Big Five trait taxonomy: History, measurement, and conceptual issues. In Handbook of personality: Theory and research (3rd ed.). New York, NY: Guilford Press.
Thomson, J. J. (1985). The trolley problem. The Yale Law Journal
Moss, A.J., & Litman, L. (2018, Sept. 18). After the bot scare: Understanding what’s been happening with data collection on MTurk and how to stop it [blog post]. Retrieved from https://www.cloudresearch.com/resources/blog/after-the-bot-scare-understanding-whats-been-happening-with-data-collection-on-mturk-and-how-to-stop-it/